



3Rs Newsletter
Research, Reads, and Recommendations
From the Office of MRSD Director of Curriculum, Instruction, and Assessment
December 2023 Newsletter


Portrait of a Graduate
Our world ‒ and the future we are preparing students for ‒ is changing at an exponential rate. In such a rapidly changing world, is what we teach, how we teach, and what we assess students on today best preparing our graduates for their futures tomorrow? Our Portrait of a Graduate process will help answer that question, and in doing so, better prepare all Monomoy students for the future.

"Creative and Critical Thinker "

Prove It To Me, Jo Boaler
Engage your learners through tasks proven to signifi cantly promote reasoning and problem solving, which touch on many of the Mathematics Teaching Practices in Principles to Actions: Ensuring Mathematical Success for All. These tasks are discussed in this article, another installment in the series.
MATHEMATICS TEACHING IN THE MIDDLE SCHOOL Vol. 24, No. 7, May 2019
Reasoning and problem solving are both critical acts in mathematics learning. I have met many teachers who tell me they would love to highlight them more but feel they cannot because of the pressures of content coverage, pacing guides, and district tests.
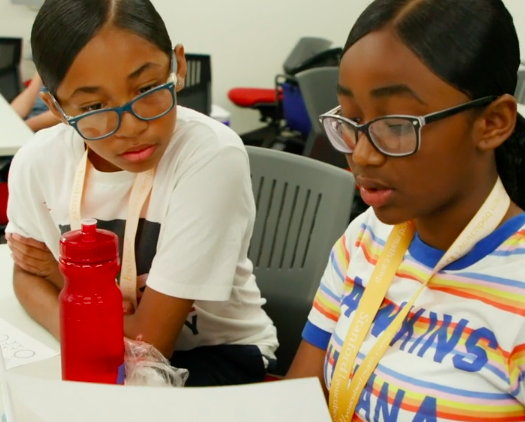
In this article, I describe a teaching intervention that highlighted problem solving and reasoning and resulted in changed mathematics pathways for students, whether they were at the low, middle, or high end of the achievement spectrum. Two summers ago, my Stanford youcubed team and I invited 83 middle school students to the Stanford campus to learn mathematics differently. I knew from many research studies that students would be helped if they were actively engaged in mathematics, solving creative and rich problems, and if they believed in their potential (Boaler 2016; 2015). I did not, however, expect the huge positive change the students made in their achievement, their beliefs about themselves, and their relationship with mathematics.
STRUCTURE OF THE YOUCUBED SUMMER CAMP
In preparation for the youcubed summer camp, I asked district math leaders if they could fi nd students who had developed negative ideas about themselves and about math. They assured me that they could and sent the details of the camp to teachers of such students. The camp was free to students, held on the Stanford campus, and offered a free bus ride to and from the camp each day. In the mornings, students worked on math in four different classrooms; in the afternoons, they formed groups of about 20 students and spent time with Stanford undergraduates, seeing different parts of campus and working on such activities as scavenger hunts and taking photographs around campus. The 83 students who came to us that summer all told a researcher when they arrived that they were “not a math person.” They could name the one person in their class who they thought was a “math person”: the student who shot up a hand first when a question was asked. Students held this faulty belief even though they came from a wide range of achievement levels.
Table 1 shows the gender and ethnicity of the students. The myth that being fast in math is important was one of many that we dispelled for the students. We also shared with them the new and important brain science showing the following:
1. Nobody is born with or without a math brain, and brains can grow and change to learn any level of school mathematics.
2. Making mistakes and struggling are the best times for brain growth.
3. Thinking visually and making connections between different representations is important for brain connections and growth.
For the next eighteen lessons, we taught students using tasks that were open, creative, and promoted reasoning and problem solving. At the end of the eighteen lessons, the improvement of the students on standardized test scores was equivalent to 2.8 years of school. Despite the diversity of the pool of students who participated in the camp, a regression analysis shows that the improvement in performance did not differentiate by gender or by ethnic group (see fig. 1). You can watch a short film showing the approach at www.youcubed.org. The curriculum we used in our summer school is available to those who attend our workshops at Stanford, and our website (https:// www.youcubed.org/tasks/) shares many of these tasks, freely available for anyone to use.
To Read On...https://www.youcubed.org/downloadable/prove-it-to-me-nctm-paper/

Fig. 1 The improvement of students in the youcubed summer school on standardized tests is shown in two graphs. The y-axis shows algebra scores; the x-axis shows each of the 83 students.
... the improvement in performance did not differentiate by gender or by ethnic group (see fig. 1)."

Fig. 2 Many smaller ideas and methods arose naturally when we taught to the Big Ideas around which we planned the youcubed camp curriculum.
"The curriculum of the youcubed camp was planned around four “Big Ideas” that we regarded as critical for the students’ mathematics learning (see fig. 2). Many of the smaller ideas and methods arose naturally when we taught to the Big Ideas. (See also https://tinyurl.com/bigideaspaper, an article that shows big ideas for all K–8 mathematics.)"

Fig. 3 In Humphreys’s skeptics framework, the easiest level of persuasion is to convince oneself.
"To encourage students to reason with one another, we taught them the skeptics framework that I learned from Cathy Humphreys. We told students that it was really good to be convincing and that the easiest level of convincing is to convince yourself of something, the next level is to convince a friend and the highest and hardest level is to convince a skeptic (see fig. 3)."


"Communicator and Leader"

Leaders Eat Last, Simon Sinek
Thank you to Mr. Travis for recommendation!
Leaders Eat Last: Why Some Teams Pull Together and Others Don't
"In his bestselling sophomore book, Leaders Eat Last, Simon takes us to the next level of understanding why some organizations do better than others by detailing all elements of the leadership challenge. For a company to be successful, its leaders need to understand the true purpose of their organization, and use that purpose as a northstar not only in how they conduct themselves as a business, but also in how they care for those in their charge."

"Engaged Citizen"
U.S. Ed. Dept.’s Office for Civil Rights Releases New Civil Rights Data
Thank you Ms. Maguire for sharing the following report:
U.S. Education Department’s Office for Civil Rights Releases New Civil Rights Data on Students’ Access to Educational Opportunities During the Pandemic
Data on an improved website from the 2020–21 school year show stark inequities in students’ educational access across civil rights indicators, including regarding courses & programs, school staff, and student discipline
The U.S. Department of Education’s (Department) Office for Civil Rights (OCR) today released new civil rights data from the 2020–21 school year, offering critical insight regarding civil rights indicators during that coronavirus pandemic year. OCR also released seven data reports and snapshots, including A First Look: Students’ Access to Educational Opportunities in the Nation’s Public Schools, which provides an overview of these data and information.
“In America, talent and creativity can come from anywhere, but only if we provide equitable educational opportunities to students everywhere,” said U.S. Secretary of Education Miguel Cardona. “We cannot be complacent when the data repeatedly tells us that the race, sex, or disability of students continue to dramatically impact everything from access to advanced placement courses to the availability of school counselors to the use of exclusionary and traumatic disciplinary practices. The Biden-Harris Administration has prioritized equity for underserved students throughout our historic investments in education, and we will continue to partner with states, districts, and schools to Raise the Bar and provide all students with access to an academically rigorous education in safe, supportive, and inclusive learning environments.”
OCR’s Civil Rights Data Collection (CRDC) is a mandatory survey of public schools serving students from preschool to grade 12. The purpose of the CRDC is to provide the federal government and members of the public with vital data about the extent to which students have equal educational opportunities required by federal civil rights laws. While OCR generally collects the CRDC biennially, the 2020-21 CRDC is the first published since the 2017-18 collection (which was released in 2020), because OCR paused the collection due to the pandemic. OCR’s 2020-21 CRDC contains information collected from over 17,000 school districts and over 97,000 schools. These data include student enrollment; access to courses, teachers, other school staff, and the Internet and devices; and school climate factors, such as student discipline, harassment or bullying, and school offenses.
The 2020-21 CRDC reflects stark inequities in education access throughout the nation. For example, high schools with high enrollments of Black and Latino students offered fewer courses in mathematics, science, and computer science than schools with low enrollments of Black and Latino students. English learner students and students with disabilities, who received services under the federal Individuals with Disabilities Education Act, had a lower rate of enrollment in mathematics and science courses when compared to enrollment rates of all high school students.
“These new CRDC data reflect troubling differences in students’ experiences in our nation’s schools,” said Assistant Secretary for Civil Rights Catherine E. Lhamon. “We remain committed to working with school communities to ensure the full civil rights protections that federal law demands.”
As part of today’s release of the 2020-21 CRDC, OCR launched a redesigned CRDC website that now includes an archival tool with access to historical civil rights data from 1968 to 1998 which can be found here. The 2020-21 CRDC public-use data file, reports, and snapshots are available on the Department’s redesigned CRDC website. Additional reports and snapshots will be posted periodically on the website.
Key data points from the 2020–21 CRDC are below and highlighted in one or more of the data reports or snapshots.
Harassment or Bullying
- K-12 students reported to school employees over 42,500 allegations of harassment or bullying on the basis of sex, sexual orientation, race, disability, or religion.
- Forty percent of allegations of harassment or bullying was on the basis of sex, 29% was on the basis of race, 19% was on the basis of sexual orientation, 9% was on the basis of disability, and 3% was on the basis of religion.
- Student reports of being harassed or bullied differed by race and sex.
- Black students represented 15% of K-12 enrollment, but 37% of students who reported being harassed or bullied on the basis of race.
- White students represented 46% of K-12 enrollment but 68% of students who reported being harassed or bullied on the basis of sex, and 70% of students who reported being harassed or bullied on the basis of disability.
- American Indian or Alaska Native students represented 1% of K-12 enrollment, but 2% of students who reported being harassed or bullied on the basis of race, sex, or disability.
- Boys were overrepresented in reports of being harassed or bullied on the basis of race or disability. Girls were overrepresented in reports of being harassed or bullied on the basis of sex.
School Offenses
- Districts reported approximately 274,700 incidents of school offenses.
- The majority of incidents (78%) were threats of physical attack without a weapon.
- Public schools reported over 3,000 incidents of rape or attempted rape and sexual assault (other than rape).
- About 180 schools (less than 1%) reported at least one incident involving a school shooting, and about 100 schools (less than 1%) reported a homicide of a student, faculty member, or staff member.
Student Discipline
- About 786,600 students in K-12 received one or more in-school suspensions, about 638,700 received one or more out-of-school suspensions, and about 28,300 received an expulsion.
- Compared to their overall enrollments, Black boys and girls, White boys, and boys of two or more races were overrepresented among K-12 students who were suspended and expelled.
- Both White and Black boys were overrepresented in K-12 school discipline outcomes, but Black boys were nearly two times more likely than White boys to receive an out-of-school suspension or an expulsion.
- When considering their overall enrollment, K-12 students with disabilities were also overrepresented in discipline outcomes.
- Students with disabilities represented 17% of K-12 student enrollment but accounted for 29% of students who received one or more out-of-school suspensions and 21% who received expulsions.
- The nation’s public school districts referred approximately 61,900 K-12 students to law enforcement, and about 14% of those referrals resulted in school-related arrests. These disciplinary actions differed by students’ race/ethnicity and disability.
- Black students represented 15% of K-12 student enrollment, but 18% of students referred to law enforcement and 22% of students subjected to a school-related arrest.
- White students represented 46% of K-12 student enrollment, but 55% of students referred to law enforcement and 47% of students subjected to a school-related arrest.
- Students with disabilities represented 17% of K-12 student enrollment, but 27% of students referred to law enforcement and 28% of students subjected to a school-related arrest.
Restraint and Seclusion
- Approximately 52,800 K-12 students were physically restrained, mechanically restrained, and/or placed in seclusion at schools.
- Boys, Black students, students of two or more races, and students with disabilities who received services under IDEA were subjected to restraints and seclusion at higher percentages than their overall K-12 enrollments.
- Boys represented 51% of K-12 student enrollment, but 83% of students physically restrained, 82% of students mechanically restrained, and 82% of students secluded.
- Black students represented 15% of the K-12 student enrollment, but 21% of students physically restrained, 42% of students mechanically restrained, and 19% of students secluded.
- Students of two or more races were 4% of K-12 student enrollment yet accounted for 7% of students physically restrained and 7% of students secluded.
- Students with disabilities who received services under IDEA represented 14% of K-12 student enrollment but accounted for 81% of students physically restrained, 32% of students mechanically restrained, and 75% of students secluded.
Access to Advanced Courses
- More than half of high schools nationwide do not offer calculus or computer science.
- Some student groups have fewer opportunities to access courses.
- Approximately 35% of high schools with high enrollments of Black and Latino students offered calculus, compared to 54% of high schools with low enrollments of Black and Latino students.
- About 40% of schools with high enrollments of Black and Latino students offered computer science courses, compared to 54% of schools with low enrollments of Black and Latino students.
- Student enrollment in Advanced Placement (AP) courses differed by race or ethnicity.
- Black students represented 15% of students enrolled in high school, but 10% of students enrolled in AP computer science, 8% of students enrolled in AP science, and 6% of students enrolled in AP mathematics.
- Latino students represented 27% of students enrolled in high school, but 20% of students enrolled in AP science, 20% of students enrolled in AP computer science, and 19% of students enrolled in AP mathematics.
- White students represented 48% of students enrolled in high school, 53% of students enrolled in AP mathematics, 51% of students enrolled in AP science, and 44% of students enrolled in AP computer science.
- Asian students represented 5% of all high school enrollment, 17% of student enrollment in AP science, 17% of student enrollment in AP mathematics, and 22% of student enrollment in AP computer science.
Access to Teachers and Other School Staff
- Many students, particularly students of color, did not have access to certified teachers and school counselors.
- Approximately 522,400 students, or 1% of overall student enrollment, attended public schools where fewer than half of the teachers met all state certification requirements. Of students attending those schools, a majority (66%) were Black and Latino students.
- Ninety-six percent (96%) of high school students had access to at least one school counselor.
- Four percent (4%) of high school students attended schools with no school counselors.
- 7 million students attended a school with a school law enforcement officer (SLEO) or security guard, but without a school counselor.
- Native Hawaiian and Other Pacific Islander students and American Indian or Alaska Native students were 1.4 times more likely than White students to attend a school with an SLEO or security guard but no school counselor.
- Black students and students of two or more races were 1.2 times more likely attend these schools compared to White students.
Access to the Internet and Devices
- For the first time, for the 2020-21 school year, schools were required to report data on students’ access to the Internet and devices at schools. Students’ Internet access varied from state to state.
- Kentucky, Maryland, North Carolina, Virginia, and West Virginia reported that 99% or more of their schools were connected to the Internet.
- The states reporting the lowest percentage of schools connected to the Internet were Florida (66%) and Alaska (52%).
- Eighty-seven percent of schools reported allowing students to take home school-issued devices.
The Department’s data reports and snapshots are available here and listed below.
- A First Look: Students’ Access to Educational Opportunities in the Nation’s Public Schools highlights data from the 2020–21 CRDC on student enrollment, access to preschool programs, access to mathematics, science and computer science courses and other programs, Internet and devices, teachers and school support staff, and school climate factors.
- Student Discipline and School Climate in U.S. Public Schools highlights data from the 2020–21 CRDC on student discipline, such as suspensions, expulsion, referrals to law enforcement, school-related arrests, and corporal punishment; student harassment or bullying; and incidents of offenses.
- Student Enrollment and School Characteristics in U.S. Public Schools highlights data from the 2020–21 CRDC on student enrollment and demographics and school characteristics.
- Referrals to Law Enforcement and School-related Arrests in U.S. Public Schools highlights data on referrals to law enforcement and school-related arrests.
- Sexual Violence and Sex-based Harassment or Bullying in U.S. Public Schools provides an overview of data on sexual violence, including sexual assault and rape or attempted rape, and sexual harassment or bullying.
- An Overview of the U.S. Department of Education’s 2020–21 Civil Rights Data Collection, provides an overview of OCR’s administration of the 2020–21 CRDC.
- Civil Rights Data Quality from Start to Finish explains why data quality matters and presents steps that OCR took to improve data quality for the 2020–21 CRDC.
The Department will release additional data reports and snapshots on key topics such as student access to courses and programs and data specific to English learner students and to students with disabilities.

"Indpendent and Confident Learner"
Off the Mark: How Grades, Ratings, and Rankings Undermine Learning...
Thank you to Ms. Armstrong for recommendation!
Off the Mark: How Grades, Ratings, and Rankings Undermine Learning (but Don’t Have To)
Amid widespread concern that our approach to testing and grading undermines education, two experts explain how schools can use assessment to support, rather than compromise, learning.
Anyone who has ever crammed for a test, capitulated to a grade-grubbing student, or fretted over a child’s report card knows that the way we assess student learning in American schools is freighted with unintended consequences. But that’s not all. As experts agree, our primary assessment technologies—grading, rating, and ranking—don’t actually provide an accurate picture of how students are doing in school. Worse, they distort student and educator behavior in ways that undermine learning and exacerbate inequality. Yet despite widespread dissatisfaction, grades, test scores, and transcripts remain the currency of the realm.


A Different Way to Think About Student Success...Interview w/Ana Homayoun
Interview by Anne Helen Petersen with the author of Erasing the Finish Line, The New Blueprint for Success Beyond Grades and College Admission
Thank you to Ms. Joy for recommendation!
Anne Petersen: Every so often, I think to myself: contemporary college admissions would’ve turned me to mush. Both of my parents went to college, but I didn’t go to a rigorous high school, and there was no college admissions competition to speak of. I chose where I applied based on weird and hilarious ideas of “good” which mostly had to do with “they’re in Minnesota, and I’ve been to Minnesota” and “that smart cheerleader four years ahead of me went there.”
When I came to my guidance counselor with six applications, she sighed and shook her head. Way too many. My mom was supportive but — I think purposefully — kept her distance. She wanted me to make my own decision. I didn’t have anyone to compare myself to, and ended up choosing my college based on “feel” and “they gave me money.”
In hindsight, I was enormously lucky the pressure-cooker of college admissions wasn’t something I could opt into — because I absolutely would have. I know myself well enough to know that. Instead, I got to spend my pre-college years figuring out what I liked, being bored, working shit jobs, being even more bored, figuring out friendship, and listening to music and staring at the ceiling. Oh, and taking a few classes that really and truly challenged me — and being able to focus on those challenges, and figure out how to do hard things. I had space to do the hazy work of becoming myself. I was successful not because of my GPA or my SAT scores or my college admissions letters, but because I had begun that hard and essential work of figuring out who I was and what mattered.
Ana Homayoun is trying to help students in this current admissions environment do the same. She’s an academic advisor, but not that kind of academic advisor, and her new book, Erasing the Finish Line, shifts the paradigm of how we might think of “success” — for the students in our lives, sure, but also for ourselves. In our interview below, we talk about how college acceptance became so overdetermined, her work with neurodivergent students, shifting parents’ understanding of achievement, and why you can’t just hack the system for kids who can afford a consultant. Even if you don’t have a student in your life right now, I think you’ll find it thought-provoking.
You can find Erasing the Finish Line here, and find out more about Ana’s work here.
In the beginning of the book, you spend some time describing the “acceptance” video (on TikTok, on IG, whatever) that has become a new standard in the life of a particular type of high school students. You write:
“To me these videos represent a greater conversation around how we— and by “we” I mean parents, caregivers, educators, and students—have made getting into certain colleges an end-all, be-all, make-or-break finish line. In doing so, we’ve inadvertently created an overvalued, excessively rigid, and downright false judgment around what constitutes a “good” or “bad” launching pad to a successful life. We become caught up in a cycle that dismisses the fundamental skills critical for long-term well-being in favor of short-term results.”
To Read The Full Interview: https://annehelen.substack.com/p/a-different-way-to-think-about-student?utm_source=post-email-title&publication_id=2450&post_id=138253055&utm_campaign=email-post-title&isFreemail=true&r=lsol
Quote of the Issue
"Don’t show up to prove. Show up to improve."
Simon Sinek, Leaders Eat Last

2023-2028 MRSD Curriculum Review Cycle


Please click image for access to the document.
Monomoy Regional School District (MRSD) engages in a regular, cyclical process for curriculum review. This process is driven by educators from all levels of the MRSD learning community who collaborate to evaluate, analyze, plan, develop, and implement curriculum and instruction throughout the district schools. To be successful, the following proposed plan has been developed to provide dedicated time, support, and resources necessary to complete a “deep dive” into the core of each subject area.
Community PD Opportunity

The Massachusetts Partnerships for Youth, Inc. On Demand Library Videos
The Massachusetts Partnerhsips for Youth, Inc.
EVERY Monomoy Regional School District Employee has access to all of the MPY resources. If you have not registered already, please register at https://massachusettspartnershipsforyouth.com/dashboard/?invite=24921a726e502b3970de8f1c2559f078
You must sign in using your Monomoy email and then set your own individual password.
About Massachusetts Partnerships for Youth, Inc.
Massachusetts Partnerships for Youth, Inc. is a non-profit 501(c)(3) organization that provides training, fosters collaboration, and develops programming to increase the health and safety of students. MPY is committed to bringing cutting-edge information and high quality trainings to our constituents and endeavors to provide solution-oriented, community-based, multi-disciplinary approaches to foster mental and behavioral health, social and emotional learning, trauma sensitive classrooms and building a school culture that supports anti-racism, diversity, equity and inclusion. MPY is governed by a Board of Directors made up of school superintendents, police and fire chiefs, and other community leaders who work closely with MPY staff.
A few examples of the on-demand library videos available to Monomoy employees:
"Act As If: A Science-Based Approach to a Happier, More Confident You!
SPEAKER: Pam Garramone, M.Ed.
DESCRIPTION
William James, the ‘father of psychology’ said, ” If you want a quality, act as if you already have it.” In this fun, interactive presentation, learn how to feel happier, confident, and more persuasive! Learn how you can change your mood, mind, and thoughts through physical behavior. Don’t just think, do!
Antiracist Classrooms
SPEAKER: Raul Fernandez, Ed.D., Associate Dean for Equity, Diversity & Inclusion, Boston University, Wheelock College of Education & Human Development
DESCRIPTION
What does an antiracist classroom look like? Antiracist instructor Dr. Raul Fernandez will guide you in understanding what antiracism means in education and how you can update your pedagogy to be more inclusive, democratic, and antiracist.
Data-driven Progress Monitoring for Mental Health Services Developing Goals and Services for Students with and without IEPS
SPEAKER John Crocker, M.Ed., Director of School Mental Health & Behavioral Services, Methuen Public Schools, Founder & Director, MASMHC
DESCRIPTION
This video will support viewers’ understanding of best practices for developing counseling goals, including goals embedded in students’ IEPs. Viewers will learn about how to develop goals that include quantitative progress monitoring using psychosocial measures and design flexible service delivery plans that allow staff to fade services over time. Practical resources and examples will be provided to guide viewers in applying these practices to their work.